Server Monitoring
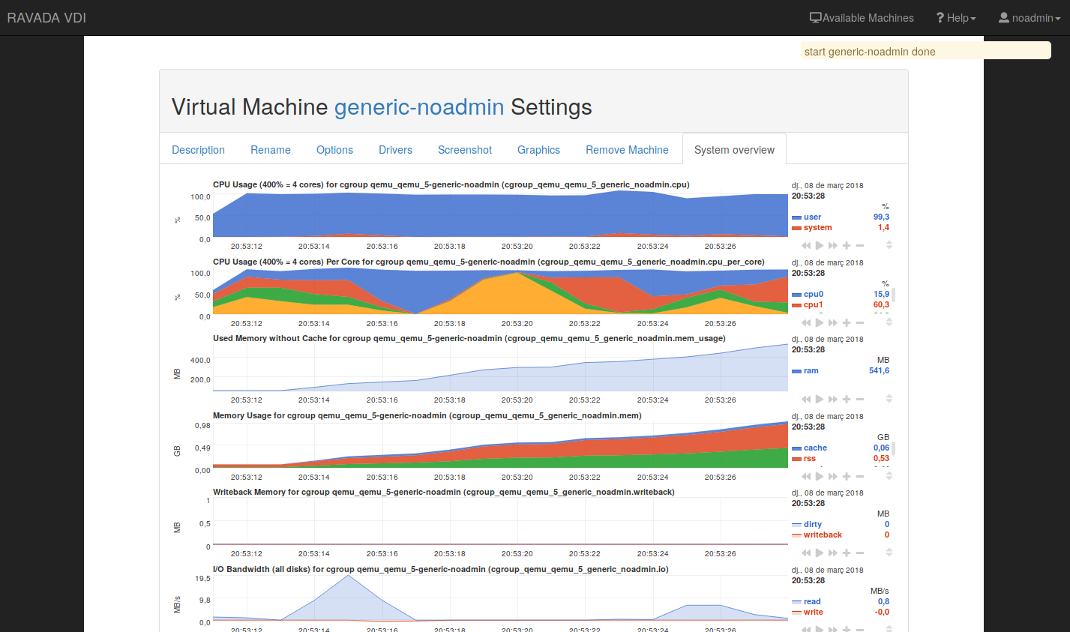
From VM settings tab you can see the VM system overview:
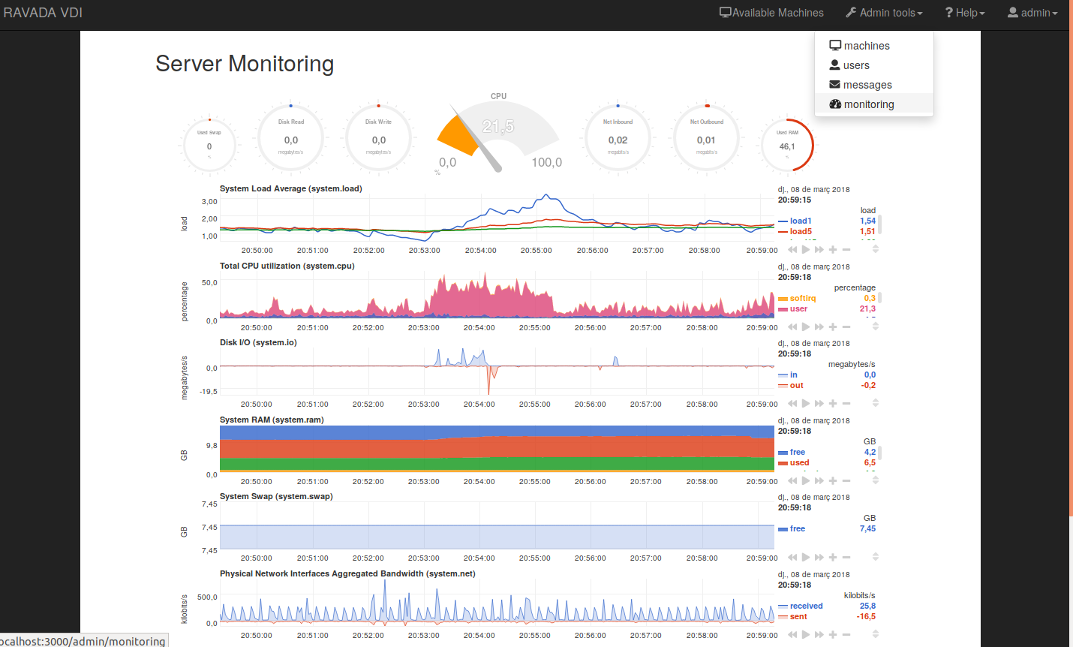
And for admin role you can see the server:
Server monitoring is disabled for default. In order to support Ravada server monitoring, you have to do a few steps:
install netdata on a ravada server
and enable monitoring in
/etc/rvd_front.conf
Install my-netdata.io
Follow this steps from my-netdata.io
or execute this on a terminal:
bash <(curl -Ss https://my-netdata.io/kickstart-static64.sh)
Linux 64bit, pre-built static binary installation for any Linux distro, any kernel version - for Intel/AMD 64bit hosts.
Apache config for netdata with SSL
Enable SSL and proxy in apache:
a2enmod proxy_http proxy ssl
a2ensite default-ssl
In /opt/netdata/etc/netdata/netdata.conf add:
[web]
default port = 19998
In /etc/apache2/ports.conf add:
<IfModule ssl_module>
    Listen 443
    Listen 19999
</IfModule>
and adding a new virtualhost for port 19999 in /etc/apache2/sites-available/default-ssl.conf
 <VirtualHost *:19999>
             ProxyRequests Off
             ProxyPreserveHost On
             ProxyPass / http://localhost:19998/ keepalive=On
             ProxyPassReverse / http://localhost:19998/

             ErrorLog ${APACHE_LOG_DIR}/error.log
             CustomLog ${APACHE_LOG_DIR}/access.log combined

             SSLEngine on
             SSLCertificateFile      /etc/ssl/certs/server.crt
             SSLCertificateKeyFile /etc/ssl/private/server.key
             SSLCertificateChainFile /etc/ssl/certs/ca.crt
</VirtualHost>
Warning
Be careful with self-signed certificates. The browser needs to accept the certificate. We recommend the use of Let’s Encrypt or your trusted SSL provider.
Then restart netdata and apache:
systemctl restart apache2
systemctl restart netdata
Thanks to @jlopezramos for this contribution.
Enable monitoring
Monitoring is disabled by default. Add in /etc/rvd_front.conf file:
monitoring => 1
Restart rvd_front service:
systemctl restart rvd_front.service
Tunning netdata
Disable mail alarms
Edit the file /opt/netdata/etc/netdata/health_alarm_notify.conf, /usr/lib/netdata/conf.d/health_alarm_notify.conf or /etc/netdata/health_alarm_notify.conf and set
SEND_MAIL="NO"
Monitoring Architecture
All servers have a local My-netdata installation, this lets us know what happens now. Metrics in real time, small story. The file of metrics is stored in the Graphite server, this allows us to obtain historical and archived data. And Grafana lets us know what happened in the past. Low detail metric, long history. Follow this link to known more about it.
Graphite backend
Edit the file /opt/netdata/etc/netdata/netdata.conf:
[backend]
    host tags =
    enabled = yes
    data source = average
    type = graphite
    destination = <GraphiteServer>
    prefix = netdata
    hostname = <hostname>
    update every = 10
    buffer on failures = 10
    timeout ms = 20000
    send names instead of ids = yes
    send charts matching = *
    send hosts matching = localhost *
Graphana
This dashboard makes our lives easier.